
Using retirement analytics to predict the shape of the future workforce
- 4 Min Read
Volatility, uncertainty, complexity and ambiguity are now part of everyday life for businesses.
- Author: Sophia Singleton
- Date published: Sep 18, 2018
- Categories
 Working in an environment of constant, disruptive change has major implications for employee demographics and workforce planning, so businesses will require support in answering the following questions:
- Is our workforce ready for disruption?
- Do we have the capabilities required to achieve our business objectives?
- How can we close any capability gaps?
- When might critical talent leave the business and how can we mitigate the risk?
In Aon’s experience, it can be a tough task for HR professionals to provide clear answers to these questions. There may be discrete pockets of data and good quality analytics in some parts of their business, but these are rarely used together to drive better planning.
To illustrate how better data and analytics can improve decision-making, we will focus on the last of the questions listed above: how to identify when critical talent will leave the business.
Predicting loss of critical talent
If we accept that businesses will always lose critical talent through retirement, there are two key issues to address:
- How can we assess when critical talent is likely to retire?
- How are changing retirement patterns affecting our workforce?
Aon’s research shows that employees see their workplace pension as a key source of financial support once they leave work. As a result, the value of their pension heavily influences how they plan for retirement.
In an environment of increasing use of defined contribution (DC) workplace pensions, fewer than half of workers now expect to retire by the age of 65:
Fig. 1
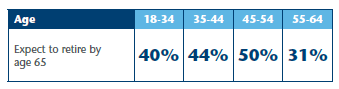
Aon Defined Contribution Member Survey 2016.
Employees’ likely retirement outcomes therefore have some clear implications for workforce planning. The chart below is from Aon’s DC analytics tool. It shows figures for one of our clients whose employees have predominantly saved into a DC pension plan. We tested each employee’s projected savings against individual retirement income targets. The bars show how many employees in each age band are rated red, amber or green, based on how likely they are to achieve their individual target.
Fig. 2 –
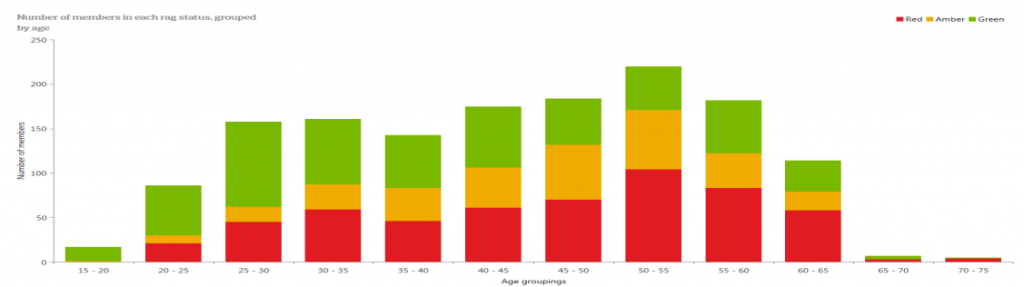
Aon Defined Contribution Member Survey 2016.
[Breakout box: How Aon sets retirement income targets. These targets have been set using Pension Commission research into adequate retirement income. This shows that lower earners need an income equivalent to 80% of their final salary at retirement, much of which will be funded by the state pension. Higher earners need a lower target income (50% of final salary at retirement), however only a small portion of this will be funded by the state pension.]
The graph shows that there is a large group of employees in their 50s and 60s whose savings are far below target. Unless their retirement savings rate increases, or there is a change to workforce practices, this company’s ageing workforce is going to become a major challenge over the next five to ten years.
Integrating pensions data with workforce modelling
With a clear picture of how individuals’ pension savings compare with their required retirement income, it becomes easier to identify:
- Who will retire when?
- Will critical talent be affected?
- How will this drive the development of future talent?
That can then feed into workforce modelling, using the following steps:
Fig 3 – How retirement analytics can be integrated into workforce planning.
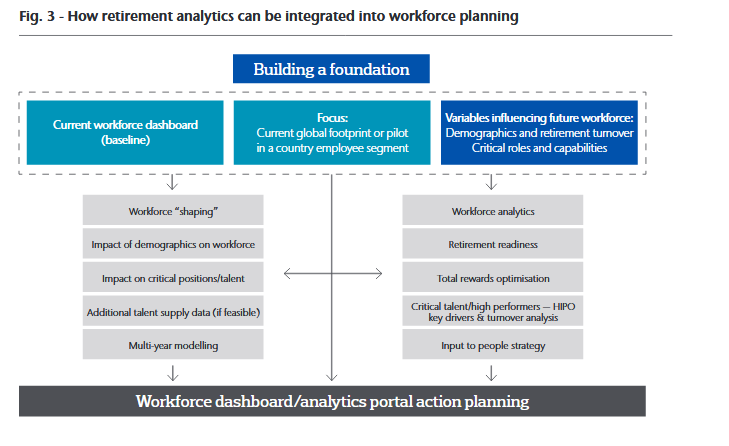
Build a foundation. This is a picture of a company’s workforce. It should use internal and external data to identify employees’ location, level and critical roles.
Test ‘what-if’ ideas. Use the foundation as a starting point for testing scenarios about the future mix of the workforce. In our example, we focused on demographic shifts around retirement.
Assess the future shape of the workforce. The next step is to evaluate how the workforce might look in the future and how that will affect the business’s ability to achieve its strategic objectives. In our example above, the company could model when workers over 50 will be able to afford to retire and the impact of that on younger generations.
Integrate the findings into workforce modelling. This model demonstrates how an isolated analysis of retirement trends can become an integral part of workforce modelling. It can be used to identify how critical talent gaps can be avoided, and to shape the demographics of the workforce.
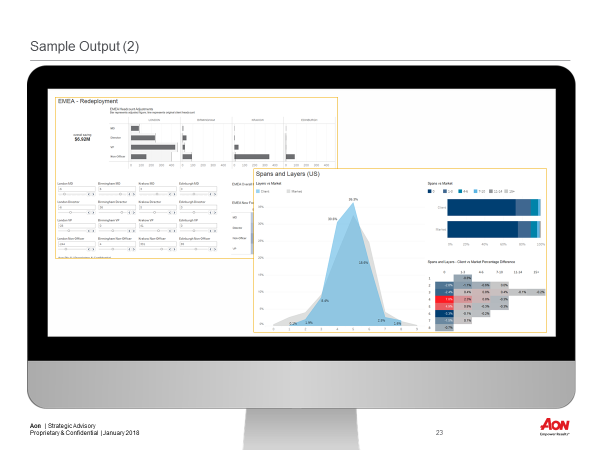
Fig. 4 – example of workforce modelling using Aon’s tools
By integrating analytics from different areas of HR into a single view, companies can make better decisions about their workforce needs. Ultimately, that will increase HR’s value as a strategic partner to the business and increase its influence on company results – by securing the talent needed for future success.
By Sophia Singleton, Partner and Head of DC Consulting, Aon